 ช้างเผือก
Categories
Statistics
Since 08.08.2014
Counts only, if "DNT = disabled".
Your IP is 3.133.79.70
ec2-3-133-79-70.us-east-2.co
Counts only, if "DNT = disabled".
Your IP is 3.133.79.70
ec2-3-133-79-70.us-east-2.co
Info

เราจะทำแบบวิศวกรผู้ยิ่งใหญ่

27. April 2024
Your valuable opinion :
Envico_Software_Data_Hijacker.php 46032 Bytes 12-02-2018 11:22:26
ENVICO :: Software Data Hijacker
As we don't keep the data, nor do we steal them (they are still there) nor want to blackmail a reward,
we prefer the more friendly version : "borrow". This is for educational reasons, anyway.
1) Data is somewhere in the sourcecode (#1, #3)
Let's say we are interested in humidity. Of course, not in our town, as we could measure that
by ourselves, but may be in Hua Hin. We therefore have to find a website which offers that kind of information.
After some googling, we may find this website.
When searching a suiteable website, make shure it does update its data 24 hrs !
A quick look at the sourcecode reveals its construction details. It's a table which contains our desired value in line 240.
(third line, here)
A quick look at the sourcecode reveals its construction details. It's a table which contains our desired value in line 240. (third line, here)
<TABLE border="0" cellpadding="0" cellspacing="0" width='100%'> <TR><TD width='50%'>Dew point</TD><TD>17.9°C</TD></TR> <TR><TD>Relative Humidity</TD><TD>73 %</TD></TR> <TR><TD>Wind</TD><TD>300/5.6 km/hr</TD></TR> <TR><TD>Cloud</TD><TD>Fine</TD></TR> <TR><TD>Visibility</TD><TD>5 km</TD></TR> <TR><TD>Pressure</TD><TD>1015.6 hPa</TD></TR> <TR><TD>Amout of Rainfall (3hr)</TD><TD>0.0 mm</TD></TR> </TABLE>
We can easily load a copy of this website into a variable e.g. $website. This is done with the file_get_contents()
command. After that, we can search for the start. In our case this may be 'Relative Humidity'. In php this is done with
strpos(). With the same command, we may also search for the end, which is '%'.
Searching for '%' in a html document is not that clever, as it may lead to a wrong position due to its often use. Make sure your search-string is unique !
You may as well use a defined length, which is three characters (Relative Humidity = 1 %) up to five characters (Relative Humidity = 100 %). We use a length of four characters,
assuming that the humidity is always between 10 % and 99 %. Now we can create a new string which just contains the four characters of interest. In php, this may be done with
substr(). The whole script then looks like this :
You may as well use a defined length, which is three characters (Relative Humidity = 1 %) up to five characters (Relative Humidity = 100 %). We use a length of four characters, assuming that the humidity is always between 10 % and 99 %. Now we can create a new string which just contains the four characters of interest. In php, this may be done with substr(). The whole script then looks like this :
<?php
// LOAD THE CONTENTS INTO $website
$website = file_get_contents("http://www.tmd.go.th/en/province.php?id=71");
// FIND OCURRENCE OF "Relative Humidity".
// INCREASE POINTER BY LENGTH OF OCURRENCE : + 26 CHARACTERS
$start = strpos($website,"Relative Humidity") + 26;
// OUTPUT THE STRING, ASSUMING A LENGTH OF 4 CHARACTERS
echo substr($website,$start,4);
?>
Executing this file on your webserver will produce the following result :
2) Data is a software measurement (#2)
Software measurement in this case means something like : do something where internet is involved and measure the time used.
In our case, we measure the time which elapses to load a website. This can then be regarded as a figure to estimate the traffic. (Yes, you
may as well consider the size of the website to get a figure like kB/ms).
We use microtime(), which delivers
a unix timestamp in microseconds. Multiplying with 1000 delivers a result in milliseconds. The whole script then looks like this :
<?php
$time_start = microtime(true);
// LOAD THE CONTENTS INTO $website
$website = file_get_contents("http://www.quantumoptics.ethz.ch/");
$time_end = microtime(true);
$messwert = number_format((1000*($time_end - $time_start)), 0, '.', '');
echo($messwert);
?>
Executing this file on your webserver will produce something similiar to this :
3) Data is hidden provided with another script (#4)
Some information provider e.g. Coinmill.com offer information, which is encapsuled in a java- script.
This may be very comfortable for internet newcomer, because it allows adding functionality without the knowledge of html, php or any other programming language.
But we are intersted in the raw data, so we have to extract them from a script.
<<script><!--
var currency_rate_list=new Array("CHF","THB");
var currency_template="<a href=\"$link\">The $from_abbrev is worth
<b>$rate</b> $to_abbrevs </a><br/>";
var currency_round=true;
//--></script>
<script src="http://coinmill.com/frame.js"></script>
First, some variables are defined and initialised, then another java-script is called which delivers the output. As we are just interested in
one number (e.g. the THB-CHF exchange rate), a look at the second javascript is recommended. Having a look at frame.js
shows its structure. First a very long array, holding all exchange rates is defined, the some javascript disassembles this array and calculates
the required value. (The four dots '....' stand for more data)
var currency_data='ADP,0.00533619,1|....|CHF,0.722289,0.05|....
....|TGC,0.009518,0.01|THB,0.0197272,0.25|THO,0.01986,0.25|....
....|ZWL,6.51216E-5,0.01|ZWN,6.51216E-30,5|ZWR,6.51216E-17,0.01';

var currency_sdrPer=new Array(),currency_Unit=new Array();
function currency_make_arrays(){var d=currency_data.split("|");
for(var e=0;e<d.length;e++){var b=d[e].split(","),f=b[0]; ....
All we need is just the value CHF,0.722289,0.05 and THB,0.0197272,0.25. As we use php, we can find them with strpos()
much easier. The intersting figure is calculated by division of these two values, as they both refer to the SDR value.
The value of the SDR was initially defined as equivalent to 0.888671 grams of fine gold, which, at that time, was an equivalent to one U.S. dollar.
After the collapse of the Bretton Woods system in 1973, however, the SDR was redefined as a basket of currencies, today consisting of the Euro, Japanese yen,
Pound sterling, and U.S. dollar. www.imf.org
Our php script finally looks like this : (Advanced: Check if exchange rates are up to date :-)
The value of the SDR was initially defined as equivalent to 0.888671 grams of fine gold, which, at that time, was an equivalent to one U.S. dollar. After the collapse of the Bretton Woods system in 1973, however, the SDR was redefined as a basket of currencies, today consisting of the Euro, Japanese yen, Pound sterling, and U.S. dollar. www.imf.org
Our php script finally looks like this : (Advanced: Check if exchange rates are up to date :-)
<?php
// LOAD THE CONTENTS INTO $website
$website = file_get_contents("http://coinmill.com/frame.js");

// FIND OCURRENCE OF "|CHF,".
// INCREASE POINTER BY LENGTH OF OCURRENCE : + 5 CHARACTERS
$start = strpos($website,"|CHF,") + 5;
$temp = substr($website,$start,20);
// FIND OCURRENCE OF ",".
$stop = strpos($temp,",");
$chf = substr($temp,0,$stop);

// FIND OCURRENCE OF "|THB,".
// INCREASE POINTER BY LENGTH OF OCURRENCE : + 5 CHARACTERS
$start = strpos($website,"|THB,") + 5;
$temp = substr($website,$start,20);
// FIND OCURRENCE OF ",".
$stop = strpos($temp,",");
$thb = substr($temp,0,$stop);

// CALCULATE AND BEAUTIFY RESULT
$messwert = number_format(($chf / $thb), 6, '.', '');
echo($messwert);
?>
4) Triggering / Timebase
You may refresh you data, whenever a guest surfes on your website. This will slow down the loading of the website. If you have a lot
of traffic, your "data-host" may discover it, and probably may not be amused. Evil websites deliver different results, when
asked by a script.
A more convenient solution would be to update the value every hour automatically and store it temporarily on your webserver. If you want to do some statistics
or lets say an overview of the last 24 hours, there is no way around it. For this task, we need some kind of (reliable) trigger.
You may use a browser which reloads a website every hour or so. This works fine for testing, but has some drawbacks. Execution time of the script called
by the website (which is refreshed) delays the time intervalls. A (short) interrupt of the internet connection will completely stop refreshing.
A php-script with sleep() will end up in an internal server error. (Error 500).
A fake cron job is based on the traffic of visitors. (Triggering is traffic dependant).
We therefore use Cron to call our update scripts on a regular timebase. (After having tested the above solutions). As the setupt of cron was tricky (for me), here are the successful commands :
-q /httpdocs/yourscript.php
You php script must be expanded by this very first line :
A more convenient solution would be to update the value every hour automatically and store it temporarily on your webserver. If you want to do some statistics or lets say an overview of the last 24 hours, there is no way around it. For this task, we need some kind of (reliable) trigger.
You may use a browser which reloads a website every hour or so. This works fine for testing, but has some drawbacks. Execution time of the script called by the website (which is refreshed) delays the time intervalls. A (short) interrupt of the internet connection will completely stop refreshing. A php-script with sleep() will end up in an internal server error. (Error 500). A fake cron job is based on the traffic of visitors. (Triggering is traffic dependant). We therefore use Cron to call our update scripts on a regular timebase. (After having tested the above solutions). As the setupt of cron was tricky (for me), here are the successful commands :
-q /httpdocs/yourscript.php
You php script must be expanded by this very first line :
#!/usr/bin/env php
<?php
// do something useful
?>
5) Data Storage
Data storage is done in a flat datafile. Nothing special at all. We use two files, one holds just the last value ('current value') and the
other holds the last 48 values with their corresponding timestamp. The last update is the filetime() of the file 'current.csv'.
6) Graph / Picture
We use pChart to generate the graph/picture. It can import flat datafiles
which just consist out of a comma separated list like $time,$data,. (csv). When setting up a new sensor, a dummy list is prepared, as our scripts just remove the
first entry and add a new entry at the end. Our datafile is limited to 48 values, as this is just for demonstartion and because the grid becomes
confusing, when using too much data. Other solutions may be RRDtool (by Tobi Oetiker) which is used
in our 'professional' version, handled and maintained by it-professionals :-)
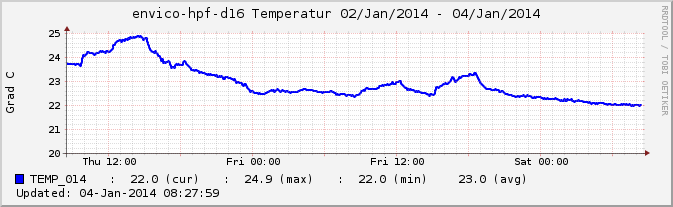
➤ Temperature in my office (RRDtool). Do you see the long lunch-break on friday ?
7) Some Examples
Humidity at Suvarnabhumi Airport (Bangkok, Thailand). Last 24 hours
Data is from : Suvarnabhumi Airport (Website).
 Download Sourcecode.
Humidity : %
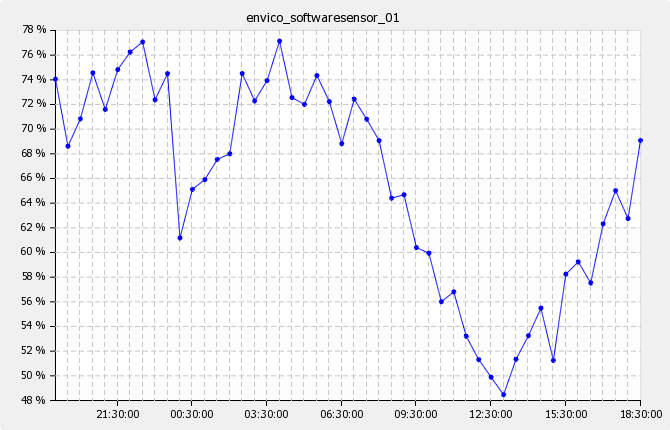
➤ Graph uses local time of Bangkok, Thailand ! As the raw data is raw (จริงๆ) we smoothed a little.
Loading time of website www.quantumoptics.ethz.ch. Last 24 hours
Data is generated with the use of microtime().
Download Sourcecode.
Loading time : ms

➤ Scale is fixed in order to force integer scaling
➤ Values are limited to max. 1000 ms. Just for beautifying reasosns.
Occurrence of "ETH quantum optics" when searching Lycos.ch. Last 48 days
Occurrence of "MPI quantum optics". Just to compare :-)
Data is extracted from Lycos.ch.
Download Sourcecode.
ETH : hits, MPI :
➤ Sourcecode of Big G is somehow encrypted, 'Bing' delivers less hits when asked by a script,...
Exchange rate of CHF • THB. Last 48 days
Data is from http://de.coinmill.com/.
Download Sourcecode.
Rate : 1 CHF ~ THB
➤ Embedding a javascript as not foreseen by the original author.
➤ A constant value suggests that the source did not update its data ...
8) Outlook
In order to perfect this kind of "measurement" there is still some potential left. In the case of the exchange rate, one
could also evaluate the "last update" of those values. Furthermore, one could check if these values make any sense at all.
If the current value differs much from the last one, one should doubt it. Like in aviation, the evaluation of several sources - which
must of course be independant - is a good idea.
Questions like 'what happens if there is no data ?' for example if the request to
your website in Uzbekistan times out, must be answered. Maybe one repeats the last value ?
On the other hand, one could send an email if an exception occurs : no data, strange data, temperature goes out of a defined window,
exchange rate is extremely good :-) or ...
This small tutorial is just to show, how one could start such a task.
Questions like 'what happens if there is no data ?' for example if the request to your website in Uzbekistan times out, must be answered. Maybe one repeats the last value ?
On the other hand, one could send an email if an exception occurs : no data, strange data, temperature goes out of a defined window, exchange rate is extremely good :-) or ...
This small tutorial is just to show, how one could start such a task.
✈ Share your thoughts
The webmaster does not read these comments regularely. Urgent questions should be send via email.
Ads or links to completely uncorrelated things will be removed.
Your Browser says that you allow tracking. Mayst we suggest that you check that DNT thing ?
|
t1 = 6498 d
t2 = 310 ms |
★ ★ ★ Copyright © 2006 - 2024 by changpuak.ch ★ ★ ★
|

|