 ช้างเผือก
Categories
Statistics
Since 08.08.2014
Counts only, if "DNT = disabled".
216.73.216.253
216.73.216.253
Counts only, if "DNT = disabled".
216.73.216.253
216.73.216.253
Info

เราจะทำแบบวิศวกรผู้ยิ่งใหญ่

27. July 2026
YOUR OPINION •••
average: 9.000, n: 1

When using this form, your ip is stored in order to avoid multiple voting on the same website. That's it.
When using this form, your ip is stored in order to avoid multiple voting on the same website. That's it.
PyLab-LongTerm-0301.php 10053 Bytes 04-03-2025 19:13:24
Python Lab Experiments - Datalogger to File #1
Arduino Lab Automation Example / Exercise
No fancy setup here, so this is the view out of my office @ campus hoenggerberg.
✈ Minimum Equipment List (MEL)
| DEVICES | REMARKS |
| Almost any ....mod Device | e.g. Wanmod - must return measurement value |
| Accessories | e.g. Antenna |
We used only Arduino™ based devices here, as this simplifies the Python Script.
(PyVISA is covered in a later exercise).
✈ Goal • learning content
• Control devices in a loop
• Store data with current timestamp
• Load data to verify their integrity
• Store data with current timestamp
• Load data to verify their integrity
🐍 The Python Script
# -*- coding: utf-8 -*-
"""
Created on Tue Aug 23 09:29:39 2022

Simple Sketch to Log Data from Wanmod into file

@author: Changpuak

"""

import serial
import time


# PLEASE DON'T FORGET TO CHANGE THE NUMBER OF THE COM PORT
Wan = serial.Serial(port='COM66', baudrate=115200, timeout=.9)

time.sleep(5)           # Arduinos reset, wait to start up

FREQ = 10.7             # MHz
DELTA_TIME = 10         # sec
MAX_POINTS = 20
POINT = 1
FILENAME = 'DATA-2022-08-22-001.txt'

LEVEL = 0
TIMESTAMP = 0
x = []


def CHAT_WANMOD(x):
    Wan.write(x.encode('utf-8'))
    time.sleep(0.5)
    data = []
    line = (Wan.readline())
    while len(line) > 0:
        data.append(line)
        line = Wan.readline()
        line = line.decode('utf-8')
    return data


def EMPTY_WANMOD(x):
    time.sleep(1)
    x = b'avanti'
    while x != b'':
        x = Wan.readline()


try:
    print("CREATING FILE ...")
    f = open(FILENAME, 'w', encoding='utf-8')                # CREATE FILE
    f.write('Filename : '+FILENAME+'\n')                     # WRITE HEADER
    f.write('Delay between measurements is '+str(DELTA_TIME)+' seconds.\n')
    f.write('Start of Recording at t = '+str(time.time())+'\n')
    f.write('Timestamp (float), Value (float)\n')
    f.close()
    #
    print("SETUP WANMOD ...")
    CHAT_WANMOD('SETF:'+str(FREQ)+'\n')
    EMPTY_WANMOD(x)
    time.sleep(3)
    EMPTY_WANMOD(x)
    #
    while POINT <= MAX_POINTS:
        print(str(POINT)+' OF '+str(MAX_POINTS)+' ...')
        # GET DATA
        TIMESTAMP = str(time.time())
        LEVEL = str(CHAT_WANMOD('POW?\n'))
        LEVEL = LEVEL[3:-9]
        # WRITE TO FILE
        f = open(FILENAME, 'a', encoding='utf-8')
        f.write(TIMESTAMP+','+LEVEL+'\n')
        f.close()
        time.sleep(DELTA_TIME-2)
        POINT += 1

finally:
    Wan.close()
    print("CONNECTIONS CLOSED.")
✈ The Result : Just a simple file ...
Filename : DATA-2022-08-22-001.txt
Delay between measurements is set to 10 seconds.
Start of Recording at t = 1661172193.0619602
Timestamp (float), Value (float)
1661172201.3296232,-101.65
1661172211.172434,-101.44
1661172221.1670876,-101.06
1661172231.1629498,-101.08
1661172241.1533153,-101.63
1661172251.1480484,-101.25
1661172261.1613867,-101.24
1661172271.1514695,-101.22
1661172281.1606288,-101.34
1661172291.1362023,-101.46
1661172301.1352825,-101.22
1661172311.1336858,-101.43
1661172321.1386282,-101.28
1661172331.1255283,-101.68
1661172341.1282055,-101.52
1661172351.1192095,-101.53
1661172361.1116898,-101.69
1661172371.1051054,-101.52
1661172381.0819757,-101.54
1661172391.0858734,-101.71
🐍 To double-check your Logfile ...
# -*- coding: utf-8 -*-
"""
Created on Thu Aug 25 20:21:27 2022

Simple Sketch to Load Data from a file and draw a graph

@author: Changpuak
"""

import matplotlib.pyplot as plt

FILENAME = 'DATA-2022-08-22-001.txt'
HEADERLINES = 4
LINECOUNTER = 0

X = []
Y = []

f = open(FILENAME, 'r', encoding='utf-8')
try:
    # READ THE HEADERLINES
    while LINECOUNTER < HEADERLINES:
        LINE = f.readline()
        LINECOUNTER += 1

    # PROCESS THE DATA
    while True:
        LINE = f.readline().splitlines()      # REMOVE THE "\n"
        if LINE:
            DATA = LINE[0].split(",")
            # X.append(int(float(DATA[0])))   # MICROSECONDS NOT USED
            X.append(LINECOUNTER-HEADERLINES)
            Y.append(float(DATA[1]))
            LINECOUNTER += 1
        else:
            break

finally:
    f.close()
    # PLOT THAT THING
    plt.style.use('bmh')
    fig, ax = plt.subplots(1,1)
    ax.plot(X, Y, linewidth=1.0, color='#0000FF')
    plt.show()
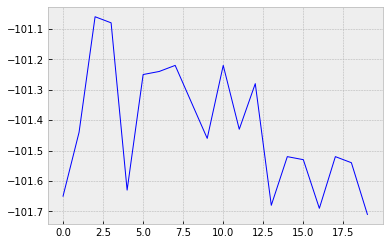
The Datafile ... visualized. A picture says more than 999 words.
✈ Share your thoughts
The webmaster does not read these comments regularely. Urgent questions should be send via email.
Ads or links to completely uncorrelated things will be removed.
|
t1 = 7319 d
t2 = 329 ms |
★ ★ ★ Copyright © 2006 - 2026 by changpuak.ch ★ ★ ★
|

|