 ช้างเผือก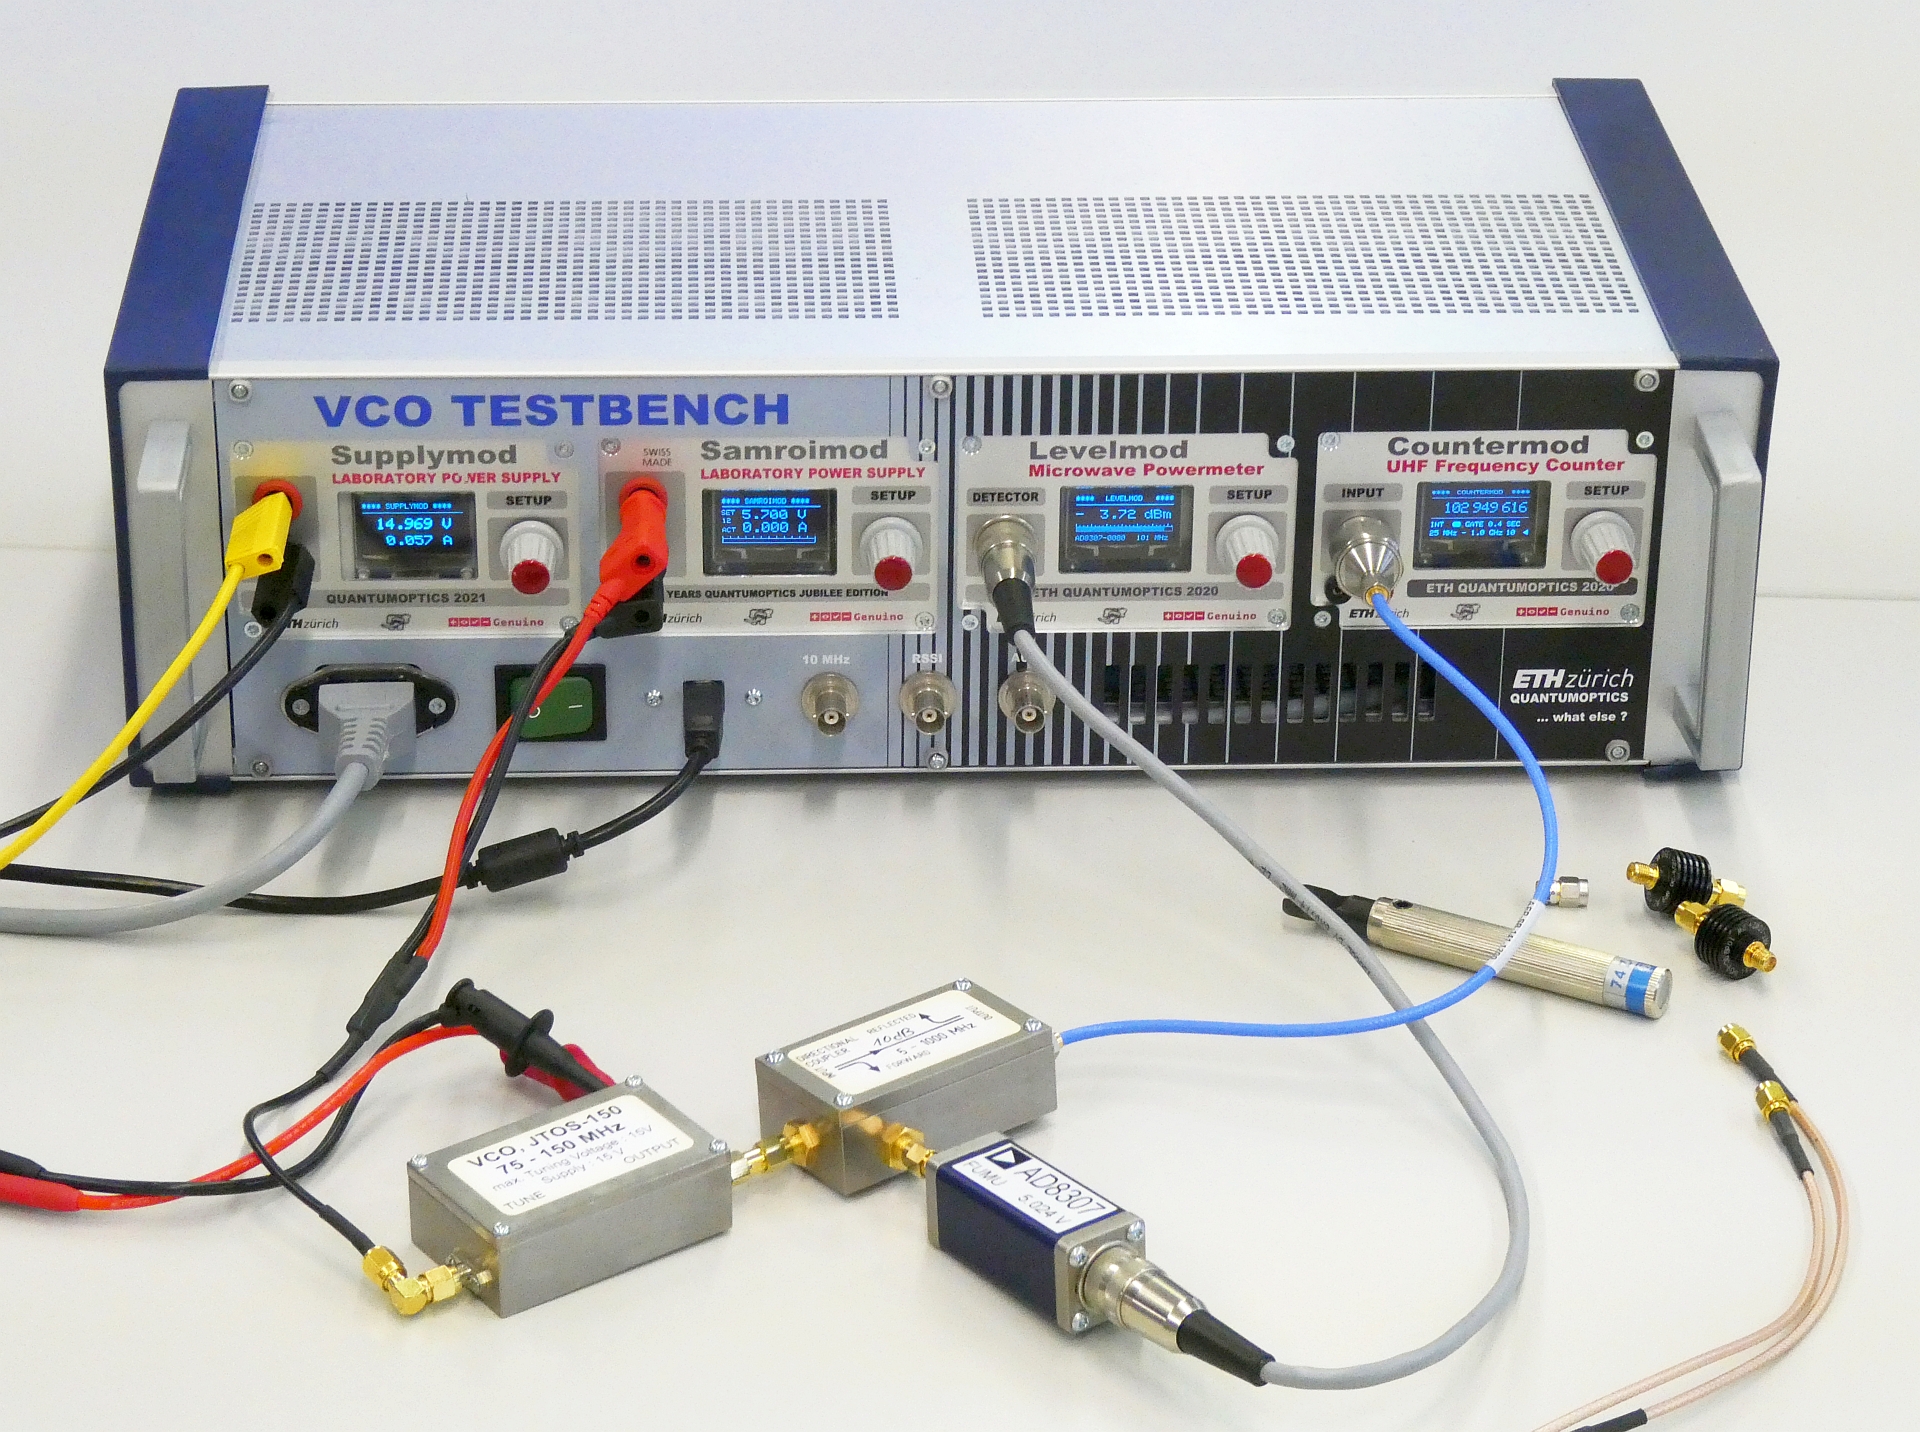
Categories
Statistics
Since 08.08.2014
Counts only, if "DNT = disabled".
216.73.216.203
216.73.216.203
Counts only, if "DNT = disabled".
216.73.216.203
216.73.216.203
Info




เราจะทำแบบวิศวกรผู้ยิ่งใหญ่
15. October 2026
YOUR OPINION •••
average: 6.000, n: 1

When using this form, your ip is stored in order to avoid multiple voting on the same website. That's it.
When using this form, your ip is stored in order to avoid multiple voting on the same website. That's it.
PyLab-VCO.php 11062 Bytes 04-03-2025 19:13:24
Python Lab Experiments - THE VCO Testbench
Arduino Lab Automation Example / Exercise
✈ Minimum Equipment List (MEL)
| DEVICES | REMARKS |
| Power Supply | Power to supply the VCO, e.g. Supplymod |
| Power Supply | sets the Tuning Voltage for VCO, e.g. Samroimod |
| Powermeter | measures the VCO Output Power, e.g. Levelmod |
| Frequency Counter | measures the VCO Frequency, e.g. Countermod |
We used only Arduino™ based devices here, as this simplifies the Python Script.
(PyVISA is covered in a later exercise).
✈ Goal • learning content
• Control multiple devices in a loop
• Plot graphs with multiple axis
• Calculate the VCO gain, Kvco [MHz/V], to be used for PLL loop filter dimensioning.
• Plot graphs with multiple axis
• Calculate the VCO gain, Kvco [MHz/V], to be used for PLL loop filter dimensioning.
🐍 The Python Script
# -*- coding: utf-8 -*-
"""
Created on Thu Jun 23 07:16:00 2022

@author: r_57, cp-9

ETH Zürich, Quantumoptics 2022
"""

import serial
import time
import matplotlib.pyplot as plt


supply = serial.Serial(port='COM10', baudrate=115200, timeout=.1)
samroi = serial.Serial(port='COM4', baudrate=115200, timeout=.1)
level = serial.Serial(port='COM9', baudrate=115200, timeout=.1)
counter = serial.Serial(port='COM11', baudrate=115200, timeout=.1)
time.sleep(5)

command = 0
befehl = "VSET:"
r = []
u = []
p = []
s = []
x = []
y = []
Vstart = 0.0           				#set min voltage
voltage = Vstart
Vstop = 15.0             			#set max voltage
xlabel = ("Tuning Voltage [V]")    	#define name of the x-axis
ylabel = ("Level [dBm]")    		#define name of the y-axis
plotname = ("JTOS-150") 			#define name of the plot
dBmmin = -60              			#set min
dBmmax = 10
poweroffset = 10
rising = 0.1
frequency = 0
frequenc = 0

def write_read_Supplymod(x):
    supply.write(x.encode('utf-8'))
    time.sleep(0.05)
    data = []
    line = (supply.readline())
    while len(line) > 0:
        data.append(line)
        line = supply.readline()
        line = line.decode('utf-8')
    return data

def write_read_Samroimod(x):
    samroi.write(x.encode('utf-8'))
    time.sleep(0.05)
    data = []
    line = (samroi.readline())
    while len(line) > 0:
        data.append(line)
        line = samroi.readline()
        line = line.decode('utf-8')
    return data

def write_read_Levelmod(x):
    level.write(x.encode('utf-8'))
    time.sleep(0.05)
    data = []
    line = (level.readline())
    while len(line) > 0:
        data.append(line)
        line = level.readline()
        line = line.decode('utf-8')
    return data

def write_read_Countermod(x):
    counter.write(x.encode('utf-8'))
    time.sleep(0.05)
    data = []
    line = (counter.readline())
    while len(line) > 0:
        data.append(line)
        line = counter.readline()
        line = line.decode('utf-8')
    return data

def readempty(x):
        time.sleep(1)
        x = b'ava'
        while x != b'':
            x = supply.readline()
            #print(x)

        x = b'ava'
        while x != b'':
            x = samroi.readline()
            #print(x)

        x = b'ava'
        while x != b'':
            x = level.readline()
            #print(x)

        x = b'ava'
        while x != b'':
            x = counter.readline()
            #print(x)

        supply.readline()
        samroi.readline()
        level.readline()
        level.readline()
        counter.readline()


try:
    readempty(x)
    freq = str(write_read_Countermod('F?'))
    freq = freq[3:-9]
    frequency = (float(freq)/1000000)
    write_read_Levelmod('*SP1!')

    while voltage <= Vstop:

        if frequency >= 76:
            write_read_Levelmod('*SP2!')

        if frequency >= 126:
            write_read_Levelmod('*SP3!')

        frequenc = frequency


        write_read_Samroimod(befehl + str(voltage))
        time.sleep(5)

        dBm = str((write_read_Levelmod('*LVL?')))
        dBm = str((write_read_Levelmod('*LVL?')))
        while dBm == ('[]'):
            dBm = str((write_read_Levelmod('*LVL?')))


        freq = str(write_read_Countermod('F?'))


        dBm = dBm[3:-6]                  #throw away unnessecary characters
        dBm = float(dBm) + poweroffset
        freq = freq[3:-9]


        frequency = (float(freq)/1000000)

        increase = (frequency - frequenc) / rising


        print(increase)
        print(voltage)
        print(frequency)
        print(dBm)
        print()


        r.append(voltage)   			#create list measurement values
        u.append(dBm)
        p.append(frequency)
        s.append(increase)

        voltage += rising              	#increase voltage


    x = [float(i) for i in r]   		#string to float conversion
    y1 = [float(i) for i in u]
    y2 = [float(i) for i in p]
    y3 = [float(i) for i in s]


    #####Plot erstellen:#####

    fig, ax1 = plt.subplots()

    ax1.set_xlabel('Tuning Voltage [V]')
    ax1.set_ylabel('Frequency [MHz]', color ='green')
    ax1.plot(x, y2, color= 'green')
    ax1.plot(x, y3, color = 'blue')

    ax2 = ax1.twinx()
    ax2.set_ylabel('Power [dBm]', color ='red')
    ax2.plot(x, y1, color = 'red')


    fig.tight_layout()
    plt.show()


finally:
    print('finally')
    supply.close()
    write_read_Samroimod('VSET:0.0')
    samroi.close()
    level.close()
    counter.close()
✈ The Result : JTOS-150
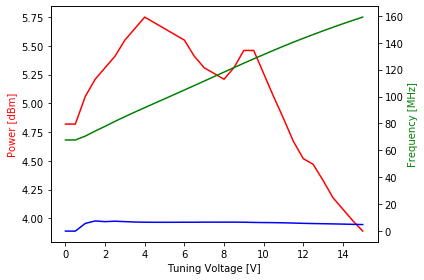
Horizontal : Tuning Voltage
Red Trace : Pwer [dBm], left
Green Trace : Frequency [MHz], right
Blue Trace : VCO Gain [MHz/V], right
✈ Share your thoughts
The webmaster does not read these comments regularely. Urgent questions should be send via email.
Ads or links to completely uncorrelated things will be removed.
|
t1 = 7399 d
t2 = 260 ms |
★ ★ ★ Copyright © 2006 - 2026 by changpuak.ch ★ ★ ★
|
|


