 ช้างเผือก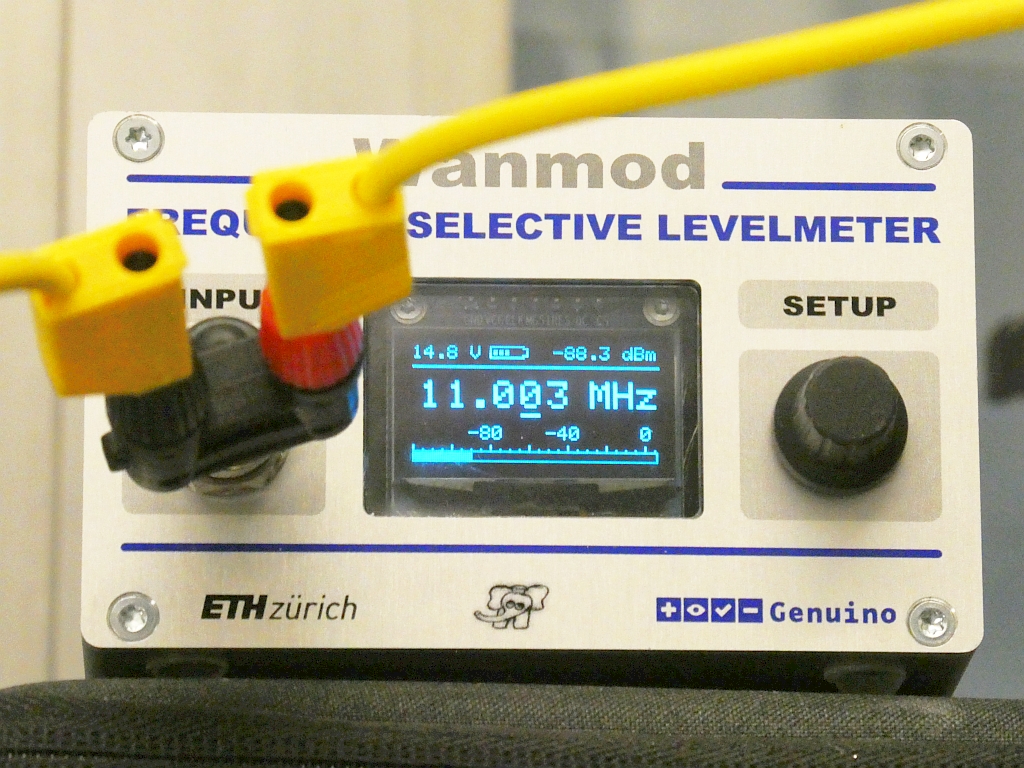
Categories
Statistics
Since 08.08.2014
Counts only, if "DNT = disabled".
216.73.217.10
216.73.217.10
Counts only, if "DNT = disabled".
216.73.217.10
216.73.217.10
Info




เราจะทำแบบวิศวกรผู้ยิ่งใหญ่
17. October 2026
YOUR OPINION •••
average: 0.001, n: 0

When using this form, your ip is stored in order to avoid multiple voting on the same website. That's it.
When using this form, your ip is stored in order to avoid multiple voting on the same website. That's it.
PyLab-HF-Band-Spectrum.php 8218 Bytes 04-03-2025 19:13:24
Python Lab Experiments - Spectrum of the HF Bands
Arduino Lab Automation Example / Exercise
✈ Minimum Equipment List (MEL)
| DEVICES | REMARKS |
| Frequency Selective Levelmeter | e.g. Wanmod |
| Antenna | Anything (conductive) from some cm to meters |
We used only Arduino™ based devices here, as this simplifies the Python Script.
(PyVISA is covered in a later exercise).
✈ Goal • learning content
• Control single devices in a loop
• Plot graphs
• Optimize graphical appearance of measurement values
• Identify strong stations / interferers
• Measure the Noisefloor and understand its meaning
• Plot graphs
• Optimize graphical appearance of measurement values
• Identify strong stations / interferers
• Measure the Noisefloor and understand its meaning
🐍 The Python Script
# -*- coding: utf-8 -*-
"""
Created on Fri Aug 19 09:09:09 2022

Simple Sketch to Sweep from F1 to F2 + Record the RSSI Level
A long wire was attached, acting as 'antenna'

@author: Changpuak

"""

import serial
import time
import matplotlib.pyplot as plt
import numpy as np


# PLEASE DON'T FORGET TO CHANGE THE NUMBER OF THE COM PORT
Wan = serial.Serial(port='COM66', baudrate=115200, timeout=.9)

time.sleep(5)           # Arduinos reset, wait to start up

FREQ_POINTS = 10
FREQ_START = 10.5       # MHz
FREQ_STOP  = 10.9       # MHz
#FREQ_DELTA = (FREQ_STOP - FREQ_START) / FREQ_POINTS
FREQ_DELTA = 0.003


WAIT = 0.5              # seconds

FREQ = FREQ_START

x = []
f = []  # Frequency
l = []  # Level


def CHAT_WANMOD(x):
    Wan.write(x.encode('utf-8'))
    time.sleep(0.5)
    data = []
    line = (Wan.readline())
    while len(line) > 0:
        data.append(line)
        line = Wan.readline()
        line = line.decode('utf-8')
    return data


def EMPTY_WANMOD(x):
    time.sleep(1)
    x = b'avanti'
    while x != b'':
        x = Wan.readline()
        # print(x)


try:
    print("STARTING SWEEP ...")
    CHAT_WANMOD('*IDN?\n')                     # REMAINS CONSTANT
    EMPTY_WANMOD(x)
    while FREQ <= FREQ_STOP:
        f.append(FREQ)                         # FILL ARRAY
        # SET FREQUENCY
        CHAT_WANMOD('SETF:'+str(FREQ)+'\n')
        EMPTY_WANMOD(x)
        # READ LEVEL
        Level = str(CHAT_WANMOD('POW?\n'))
        Level = float(Level[3:-9])
        print("{:.3f}".format(FREQ)+" MHz, "+str(Level)+" dBm")
        l.append(Level)                        # FILL ARRAY
        FREQ += FREQ_DELTA
        #
        plt.style.use('bmh')
        # plot - yes it is updated in the loop
        fig, ax = plt.subplots(1,1)
        ax.plot(f, l, linewidth=1.0, color='#0000FF')
        ax.set_title('Noisefloor, 20.08.2022 by Wanmod')
        ax.set_ylabel('RSSI [dBm]')
        ax.set_xlabel('Frequency [MHz]')
        ax.set(xlim=(FREQ_START, FREQ_STOP),
				xticks=np.arange(FREQ_START, FREQ_STOP, 0.05),
                ylim=(-110, -10), yticks=np.arange(-100, -10, 10))
        plt.show()


finally:
    Wan.close()
    print("CONNECTIONS CLOSED.")
✈ The Results ...
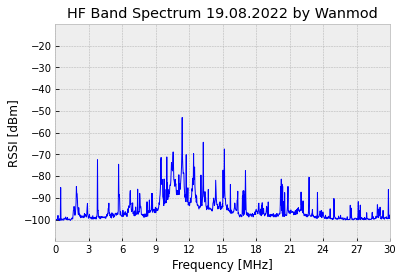
HF Spectrum from DC ... 30 MHz, simple Dipole as suggested by picture above.
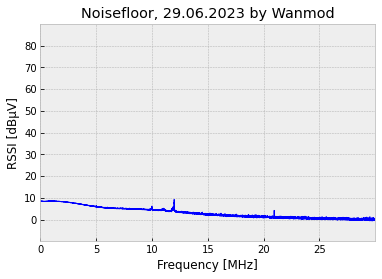
Noisefloor. Input terminated with 50 Ω. RSSI[dBm] + 107 = RSSI[dBµV].
✈ Share your thoughts
The webmaster does not read these comments regularely. Urgent questions should be send via email.
Ads or links to completely uncorrelated things will be removed.
|
t1 = 7401 d
t2 = 360 ms |
★ ★ ★ Copyright © 2006 - 2026 by changpuak.ch ★ ★ ★
|
|


