 ช้างเผือก
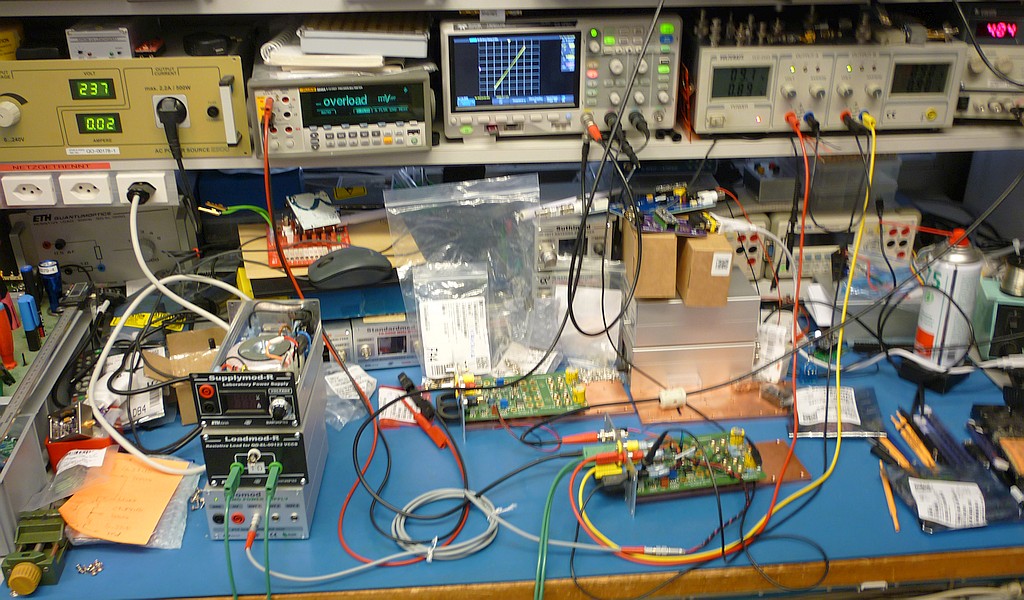
Categories
Statistics
Since 08.08.2014
Counts only, if "DNT = disabled".
216.73.216.253
216.73.216.253
Counts only, if "DNT = disabled".
216.73.216.253
216.73.216.253
Info

เราจะทำแบบวิศวกรผู้ยิ่งใหญ่
27. July 2026
YOUR OPINION •••
average: 3.667, n: 3

When using this form, your ip is stored in order to avoid multiple voting on the same website. That's it.
When using this form, your ip is stored in order to avoid multiple voting on the same website. That's it.
Voltage-Controlled-Current-Source-Characterisation.php 12345 Bytes 09-09-2025 16:57:07
Voltage Controlled Current Source Characterisation
Some kind of VCCS Knowledge Base
TEST SETUP
✈ 0. Setup Hints
This are some general tips to improve the Setup.
• Use short Connections. Low Inductance.
• Don't use a 1:10 Scope Probe - instead use a Differential Probe or 2 Probes (no GND).
• Galvanically isolate the Scope GND from the Power Supply GND.
• Use a Scope with 500 µV/DIV or less.
• Make sure, that no PC or LED lamp or any other Noise Source is near.
• Ripple is generated by charging/discharging the Storage Element. Noise is everything else.
• Watch Dave's Tutorial : EEVblog #594 - How To Measure Power Supply Ripple & Noise
• Maybe of Interest : Power Supply Characterisation
✈ 1. DC Transfer Function (Gain)
The transfer function describes how the output current (Iout) changes in response to the input
control voltage (Vin). This is often expressed as Iout = µ * Vin, where µ is the
current gain coefficient.

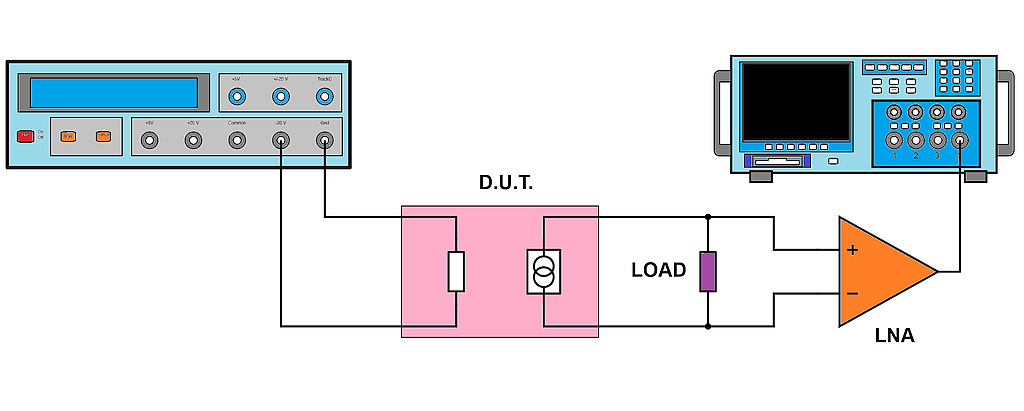
Setup:
Use a Voltage Source at the input, e.g. a Voltage Supply or an Arbitrary Waveform Generator. At the output, a Current Meter or a Resistor with a Voltmeter do the trick.
Procedure:
Apply a range of input control voltages (Vin) to the VCCS (DUT = Device Under Test). For each Vin, record the resulting output current (Iout). Plot the output current (Iout) against the input voltage (Vin) to visualise the relationship and determine the gain coefficient (µ).
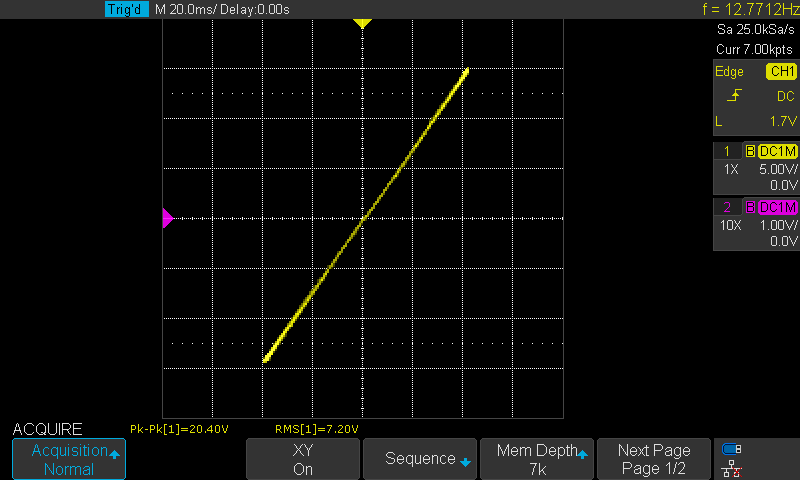
X: Input 20 Vpp SINE 12 Hz, Y: Output 1 V/A, Scope in X-Y-Mode
Note: The used Loadresistor must allow the VCCS a generous headroom for operation. We supplied the Power Stage with ±9 V, max. Current was 3 A and the Load was 1 Ω.
Setup:
Use a Voltage Source at the input, e.g. a Voltage Supply or an Arbitrary Waveform Generator. At the output, a Current Meter or a Resistor with a Voltmeter do the trick.
Procedure:
Apply a range of input control voltages (Vin) to the VCCS (DUT = Device Under Test). For each Vin, record the resulting output current (Iout). Plot the output current (Iout) against the input voltage (Vin) to visualise the relationship and determine the gain coefficient (µ).
X: Input 20 Vpp SINE 12 Hz, Y: Output 1 V/A, Scope in X-Y-Mode
Note: The used Loadresistor must allow the VCCS a generous headroom for operation. We supplied the Power Stage with ±9 V, max. Current was 3 A and the Load was 1 Ω.
✈ 2. Output Impedance
This parameter defines how the output current changes with a changing load.
Setup:
Use a Voltage Source at the input, e.g. a Voltage Supply or an Arbitrary Waveform Generator. At the output, a Current Meter or a Resistor with a Voltmeter do the trick.
Procedure:
Keep the input control voltages (Vin) to the VCCS (DUT = Device Under Test) to a constant level. Connect two differet loads at the output. Note the voltage and current for each load. The Ratio of R = ΔV / ΔI is the Output Impedance.
Warning : Operating the VCCS without a Load mayst lead to unwanted effects !!!
Therfore R = 0.347526 / 0.013345 ≈ 26.042 Ω.
Setup:
Use a Voltage Source at the input, e.g. a Voltage Supply or an Arbitrary Waveform Generator. At the output, a Current Meter or a Resistor with a Voltmeter do the trick.
Procedure:
Keep the input control voltages (Vin) to the VCCS (DUT = Device Under Test) to a constant level. Connect two differet loads at the output. Note the voltage and current for each load. The Ratio of R = ΔV / ΔI is the Output Impedance.
Warning : Operating the VCCS without a Load mayst lead to unwanted effects !!!
| LOAD | Voltage [V] | Current [A] |
| 1.0 Ω, 200 W | 0.767746 | 0.71175 |
| 1.0 Ω // 1.0 Ω, 200 W each | 0.420220 | 0.725095 |
| Δ | 0.347526 | 0.013345 |
Therfore R = 0.347526 / 0.013345 ≈ 26.042 Ω.
✈ 3. Bandwidth
The Bandwidth is the range of frequencies over which the VCCS can operate effectively. This is usually
measured with a small sinusoidal input. When using larger amplitudes, the measurements likely
are Slew-Rate limited.
Setup:
Use a Sinusoidal Source at the input, e.g. an Arbitrary Waveform Generator. At the output, a Resistor with an Oscilloscope does the trick.
Procedure:
Apply a range of different sinusoidal frequencies at the Input. For each Vin, record the resulting Vout (= R * Iout). Plot the output voltage (Vout) divided by the input voltage (Vin) versus the frequency. The Ratio of Vout / Vin is the frequency dependant Gain. The Bandwidth is usually the range, where this ratio is smaller than 3 dB. Speaking in terms of voltages, this ratio becomes 70.7 % (= 100% / sqrt(2)).
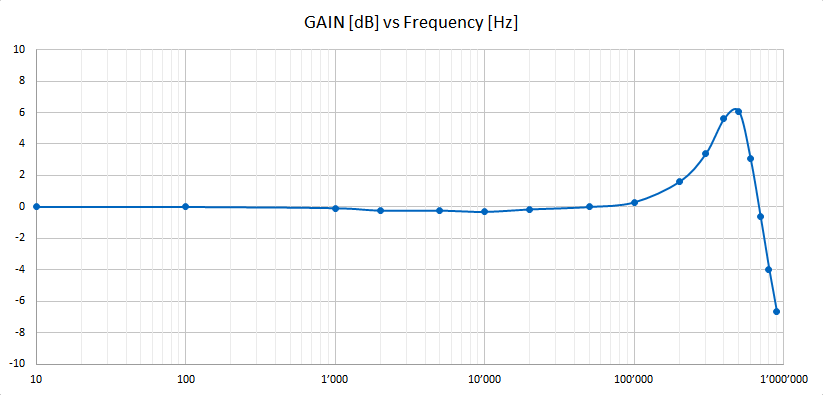
Input 4 Vpp SINE, Gain [dB] vs. Frequency. Load = 1 Ω, Supply = ±9 V
Setup:
Use a Sinusoidal Source at the input, e.g. an Arbitrary Waveform Generator. At the output, a Resistor with an Oscilloscope does the trick.
Procedure:
Apply a range of different sinusoidal frequencies at the Input. For each Vin, record the resulting Vout (= R * Iout). Plot the output voltage (Vout) divided by the input voltage (Vin) versus the frequency. The Ratio of Vout / Vin is the frequency dependant Gain. The Bandwidth is usually the range, where this ratio is smaller than 3 dB. Speaking in terms of voltages, this ratio becomes 70.7 % (= 100% / sqrt(2)).
Input 4 Vpp SINE, Gain [dB] vs. Frequency. Load = 1 Ω, Supply = ±9 V
✈ 4. Slewrate
The Slewrate is the maximum Steepness of the Slope of the Output when stimulated with a Sinewave.
Setup:
Use a Sinewave Source at the input, e.g. an Arbitrary Waveform Generator. At the output, a Resistor with an Oscilloscope does the trick.
Procedure:
Start with a very low frequency. Use the same amplitude as in Measurement #3 at the input and observe the output waveform on the Oscilloscope. Now increase the input frequency and watch. The slope will change with frequency. If the slope does not change anymore, you see the maximum Slewrate. Measure the slope. The unit will be something like V/µs or V/ms.
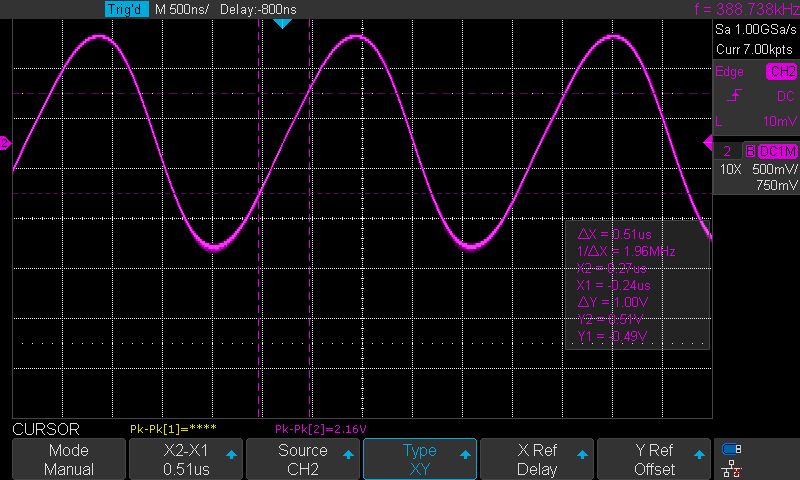
Slope = ΔY / ΔX ≈ 1 V / 0.5 µs = 2 V / µs
Setup:
Use a Sinewave Source at the input, e.g. an Arbitrary Waveform Generator. At the output, a Resistor with an Oscilloscope does the trick.
Procedure:
Start with a very low frequency. Use the same amplitude as in Measurement #3 at the input and observe the output waveform on the Oscilloscope. Now increase the input frequency and watch. The slope will change with frequency. If the slope does not change anymore, you see the maximum Slewrate. Measure the slope. The unit will be something like V/µs or V/ms.
Slope = ΔY / ΔX ≈ 1 V / 0.5 µs = 2 V / µs
✈ 5. Noise
Noise is the random fluctuations in the output current. A lower noise floor indicates better performance.
The bandwidth is usually set to 20 MHz to make comparisons easier. When using a different bandwidth, note it down.
(Noise measurements without knowing the Resolution Bandwidth are useless). As the Noise is usually small, a low noise
Amplifier (10 Hz ... 20 MHz) is used to increase Resolution as Scopes usually have a resolution of 12...16 Bit which limits
the minimum discernible signal.
Setup:
Use a (low noise) Voltage Source at the input, e.g. a Voltage Supply or an Arbitrary Waveform Generator or a 50 Ω Terminator. At the output, a Resistor with an Oscilloscope followed by a Low Noise Amplifier having a Bandwidth greater than 20 MHz.
Procedure:
Set the Source at the input to a defined level.
(Pro Tip: Find the input level where noise is minimum :-)
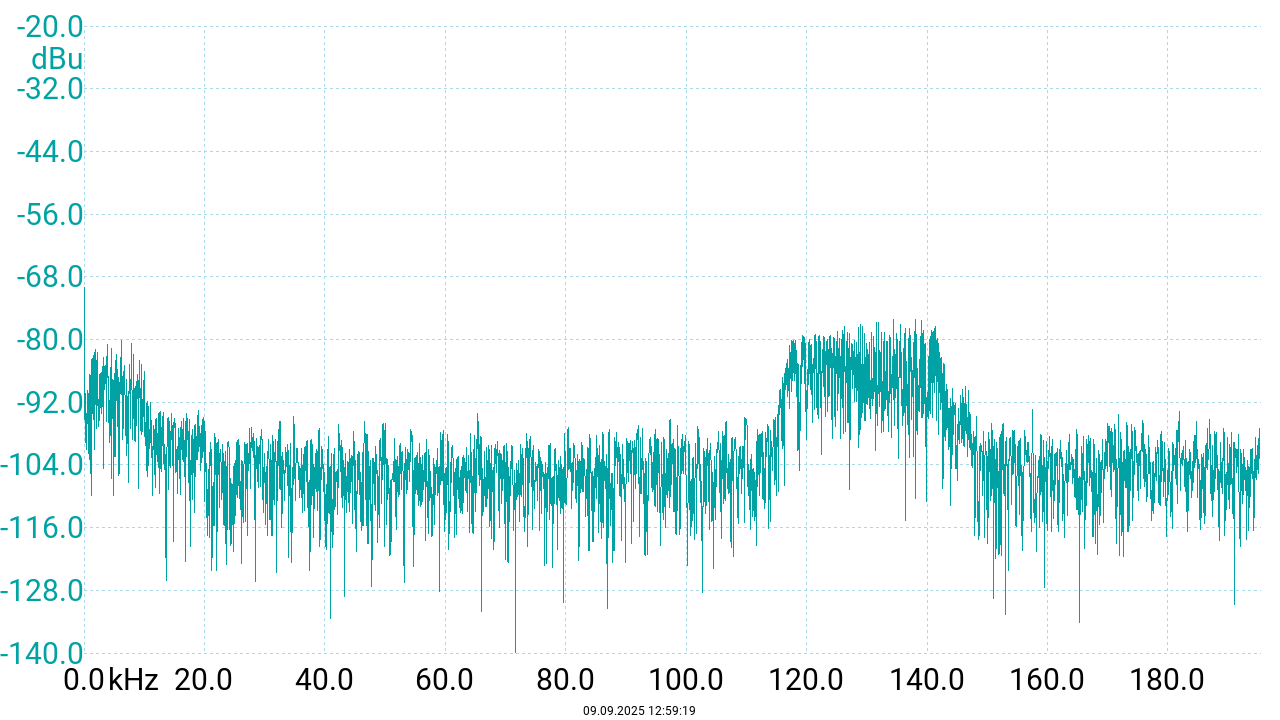
Noise Spectrum up to 200 kHz. LNA used : Alpha Lab LNA10 (Vu = 10, LP = 1 MHz)
Setup:
Use a (low noise) Voltage Source at the input, e.g. a Voltage Supply or an Arbitrary Waveform Generator or a 50 Ω Terminator. At the output, a Resistor with an Oscilloscope followed by a Low Noise Amplifier having a Bandwidth greater than 20 MHz.
Procedure:
Set the Source at the input to a defined level.
(Pro Tip: Find the input level where noise is minimum :-)
Noise Spectrum up to 200 kHz. LNA used : Alpha Lab LNA10 (Vu = 10, LP = 1 MHz)
✈ 6. Drift
Drift is an unwanted, gradual change in the output current of a current source over time, often caused by
environmental factors like temperature, or by internal components degrading.
Setup:
Use a Voltage Source at the input, e.g. a Reference Voltage Source with almost no Drift. At the output, a Resistor (target drift 0 ppm) with a High Precision Multimeter will work fine. Alternatively use a High Precision Currentmeter with Logging Capability, e.g. a Fluke™ 8846A.
Procedure:
Monitor the output current over a very long time. Preferrably also monitor environmental data like Room Temperature. In case there is some correlation visible, you know where to attack. We suggest two Timezones. The Warm-Up Drift (First 60 Minutes after Power On) and the En-Route Drift (Aything later). With the Fluke 8846A monitoring the Current after Power On, we see the following behaviour :
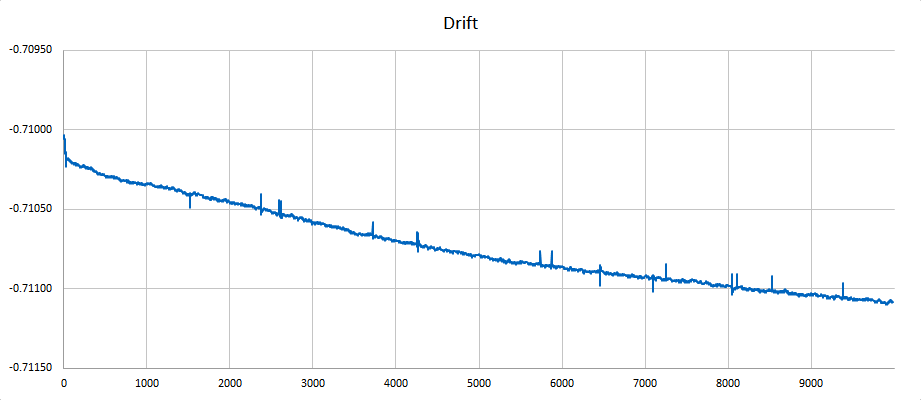
9999 Samples ≈ 2.7 hours
Setup:
Use a Voltage Source at the input, e.g. a Reference Voltage Source with almost no Drift. At the output, a Resistor (target drift 0 ppm) with a High Precision Multimeter will work fine. Alternatively use a High Precision Currentmeter with Logging Capability, e.g. a Fluke™ 8846A.
Procedure:
Monitor the output current over a very long time. Preferrably also monitor environmental data like Room Temperature. In case there is some correlation visible, you know where to attack. We suggest two Timezones. The Warm-Up Drift (First 60 Minutes after Power On) and the En-Route Drift (Aything later). With the Fluke 8846A monitoring the Current after Power On, we see the following behaviour :
9999 Samples ≈ 2.7 hours
✈ Share your thoughts
The webmaster does not read these comments regularely. Urgent questions should be send via email.
Ads or links to completely uncorrelated things will be removed.
|
t1 = 7319 d
t2 = 288 ms |
★ ★ ★ Copyright © 2006 - 2026 by changpuak.ch ★ ★ ★
|
|